Qlik Sense Desktop Evaluation
Downloading and Installing
We are on Windows 8.1, 64 bit architecture - downloading and installing Qlik Sense was a cakewalk! Approximately 120 MB download and installation happened in a smooth way. Download link is available at the bottom of the home page.
First Impressions
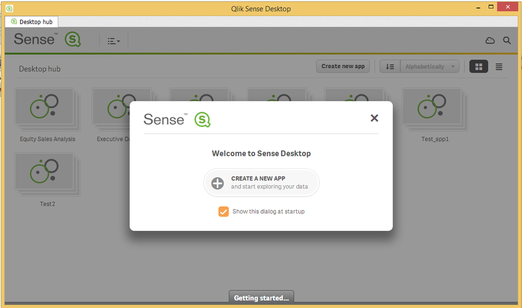
Qlik Sense impressed us in its first impressions. We came across neat, attractive layouts with simple user interface. A new app can be created and opened easily by clicking on CREATE A NEW APP button. We can load data using two options - Quick Load for Excel files and Data Load Editor to load data from web and Databases. Supported data sources include ODBC, OLEDB, Folders. So far everything looks easy and quite intuitive as they are positioning it. The data load is happening instantaneously even for the huge data sets.
We are on Windows 8.1, 64 bit architecture - downloading and installing Qlik Sense was a cakewalk! Approximately 120 MB download and installation happened in a smooth way. Download link is available at the bottom of the home page.
First Impressions
Qlik Sense impressed us in its first impressions. We came across neat, attractive layouts with simple user interface. A new app can be created and opened easily by clicking on CREATE A NEW APP button. We can load data using two options - Quick Load for Excel files and Data Load Editor to load data from web and Databases. Supported data sources include ODBC, OLEDB, Folders. So far everything looks easy and quite intuitive as they are positioning it. The data load is happening instantaneously even for the huge data sets.
Getting the hands dirty - Creating my first application
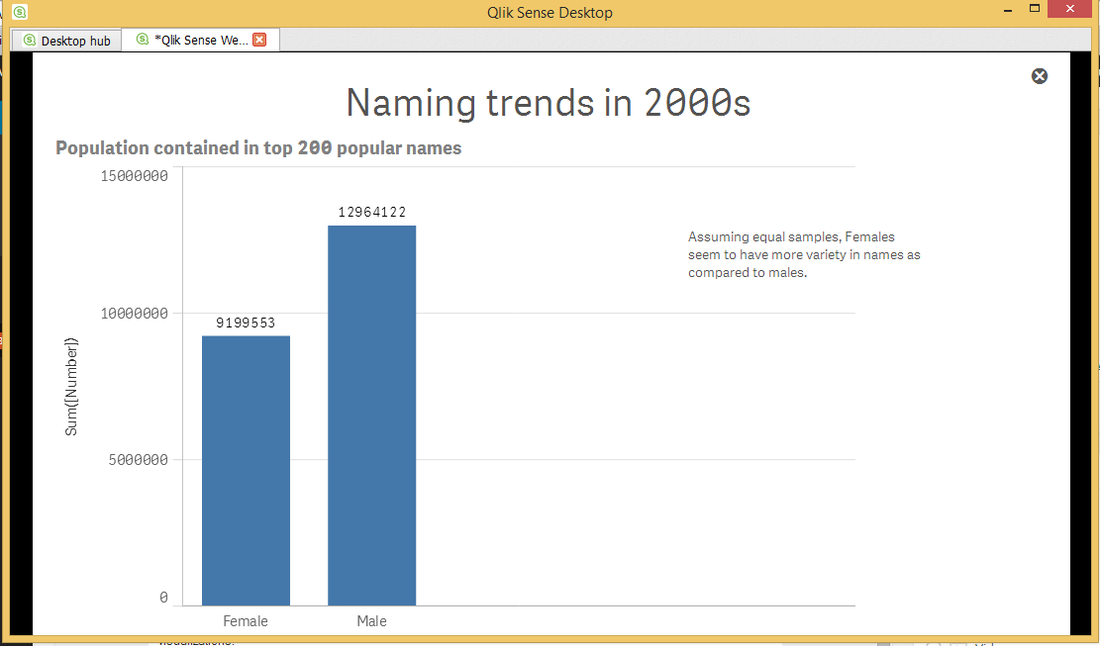
We used Qlik Sense to analyse baby names dataset, available freely on the internet. This is a fairly simple dataset - with names of 200 male and female children in the last decade. Like many data discovery tools, once data is loaded we can begin creating dashboards and adding filters. The dashboard development process was easier than ever before and where we noticed the most improvements. We liked the capabilities to add reference lines to charts and chose colors. Currently available Qlik Sense chart types include bar, combination, guage, line, map, pie, scatter and treemap. They also have table displays and an awesome option to extend visualizations using HTML, JavaScript and CSS for including customized or open source visualizations such as the popular d3.js. Like a few other vendors, Qlik is using OpenStreetMap. This is an outstanding feature to plot the data on the street map. It was a little tricky in Qlik Sense when compared with other vendors - we needed to add a GeoMakePoint code snippet to our data load script.
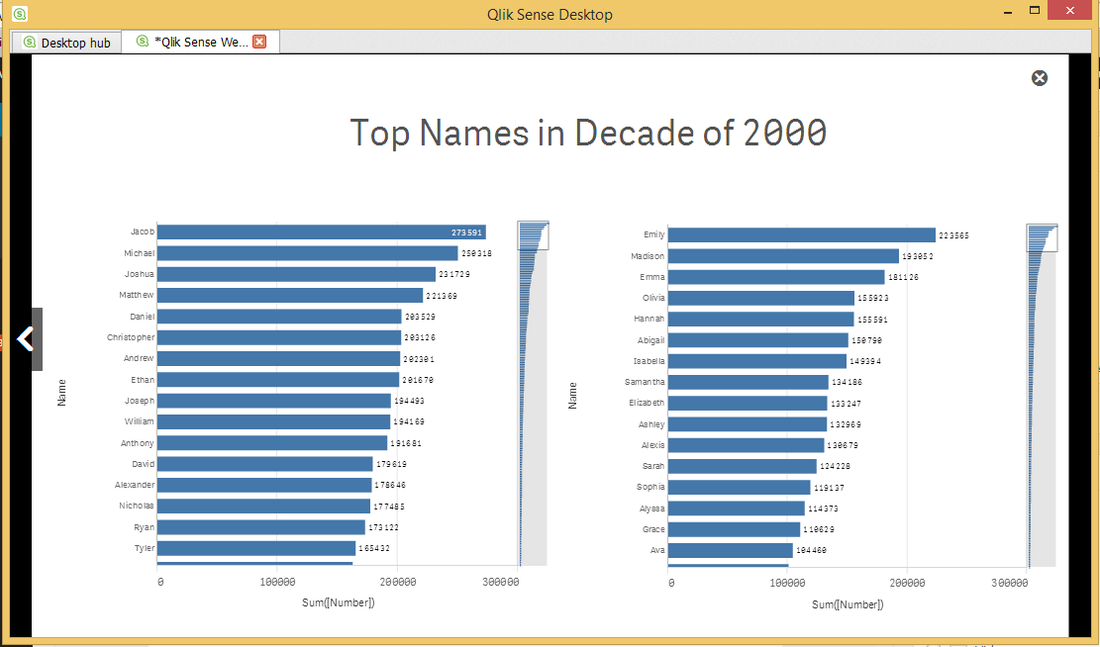
We have started our dashboard by creating a simple chart to get total number of babies named in a bar chart by Gender and it was easy. Next, we thought to create a cross-table with Names on vertical axis and Gender on horizontal axis. While the simple table was showing the sum by Gender, we could not drag it on the horizontal axis. After searching on Qlik Community, we saw that we can create some of these applications in Qlikview (sister product of Qlik Sense) and then import them in Qlik Sense - but doing so kills the philosophy of the product - giving new users the power to create powerful applications.
A few awesome features
There are a few awesome features Qlik Sense has come with. A few notable features that we appreciated included the way Qlik Sense presents search and associated green, white and light grey "hints" provoking thought into other questions to ask. We loved the range selections, lasso filtering, bookmarks that allow you to saved filter sections and smart scrolling charts with larger data sets. If data does not fit into the chart area in Qlik Sense Desktop, a scrollable chart with situational context is shown. In a world of big data, this capacity to quickly skim entire context and zoom into areas of interest is truly excellent.
Best in Class Storytelling
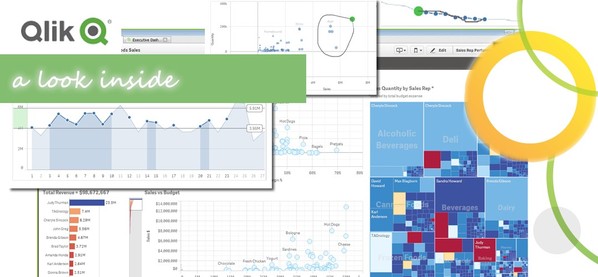
We are really impressed with Qlik's specific implementation of story telling. We feel that Qlik Sense has the best storytelling that we have seen out of all the other vendors today and urge you to watch their storytelling video. Here are the 2 slides, we created with the small data set we had:
We used Qlik Sense to analyse baby names dataset, available freely on the internet. This is a fairly simple dataset - with names of 200 male and female children in the last decade. Like many data discovery tools, once data is loaded we can begin creating dashboards and adding filters. The dashboard development process was easier than ever before and where we noticed the most improvements. We liked the capabilities to add reference lines to charts and chose colors. Currently available Qlik Sense chart types include bar, combination, guage, line, map, pie, scatter and treemap. They also have table displays and an awesome option to extend visualizations using HTML, JavaScript and CSS for including customized or open source visualizations such as the popular d3.js. Like a few other vendors, Qlik is using OpenStreetMap. This is an outstanding feature to plot the data on the street map. It was a little tricky in Qlik Sense when compared with other vendors - we needed to add a GeoMakePoint code snippet to our data load script.
We have started our dashboard by creating a simple chart to get total number of babies named in a bar chart by Gender and it was easy. Next, we thought to create a cross-table with Names on vertical axis and Gender on horizontal axis. While the simple table was showing the sum by Gender, we could not drag it on the horizontal axis. After searching on Qlik Community, we saw that we can create some of these applications in Qlikview (sister product of Qlik Sense) and then import them in Qlik Sense - but doing so kills the philosophy of the product - giving new users the power to create powerful applications.
A few awesome features
There are a few awesome features Qlik Sense has come with. A few notable features that we appreciated included the way Qlik Sense presents search and associated green, white and light grey "hints" provoking thought into other questions to ask. We loved the range selections, lasso filtering, bookmarks that allow you to saved filter sections and smart scrolling charts with larger data sets. If data does not fit into the chart area in Qlik Sense Desktop, a scrollable chart with situational context is shown. In a world of big data, this capacity to quickly skim entire context and zoom into areas of interest is truly excellent.
Best in Class Storytelling
We are really impressed with Qlik's specific implementation of story telling. We feel that Qlik Sense has the best storytelling that we have seen out of all the other vendors today and urge you to watch their storytelling video. Here are the 2 slides, we created with the small data set we had:
They have done a great job with storytelling combining interactive visualization presentation and exploratory analysis in PowerPoint-like experience. When we first saw it, we immediately thought of what Power View started to deliver back in SQL Server 2012 days when there was slides and export to PowerPoint. Qlik's storytelling approach allows us to take static snapshots or embed live visualizations into slides. WOW, what an innovative and super cool feature! We also liked that we could add pointers, commentary and other elements to stories just like we can in PowerPoint.
Why is this feature a winner? Because it addresses most of the business users need. There have been instances, when business users have created dashboards to analyse data and then added stories in a sheet upfront through text boxes and use of bookmarks - but we have to admit, it was a mess. This storytelling feature makes life so much easier - we can now lead our discussions through the visualizations, without having to switch between PowerPoint and the tools.
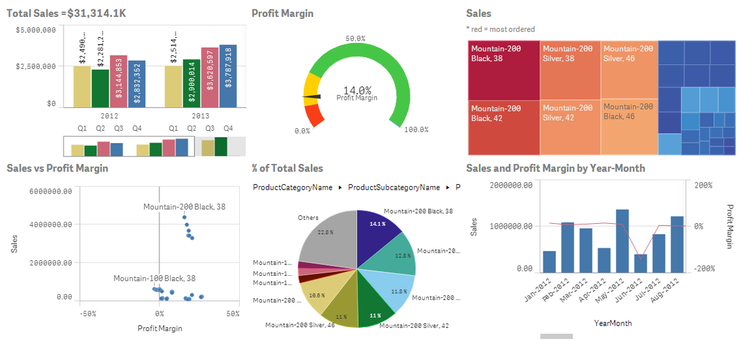
In this software, in a single dashboard we can have multiple applications. This feature allows business users to analyze the same data using different visualization formats. For instance in the above figure, we have pie chart, bar chart, tree diagram, scatter plot etc.
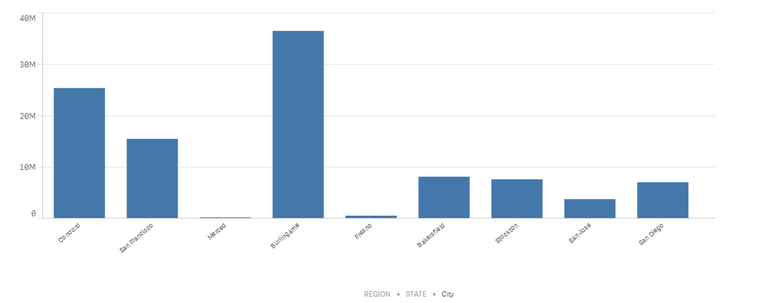
Drill-down is another amazing feature of Qlik Sense product. Drill-down groups allow us to form a single field dimension that create a natural hierarchy of existing fields in the table model. With drill-down groups you can first display a high-level summary and then "drill" into the detail from one or multiple sense visualizations. To explore this feature, we have considered sample sales data which contains Region, Country and State details. The result of drill-down operation is depicted in the below image. If the user clicks on STATE, only state's information will be displayed and if REGION is selected, only regions will be displayed in the output.
Publishing and Sharing Apps
This is a smart move from QlikTech. To share Qlik dashboard apps, we can eventually publish them to a Qlik Sense Server or the Cloud. Qlik Sense allows users to share their work without any restrictions to anyone who has Qlik Sense installed.
Overall Verdict
Sadly, it looks like, we ended up expecting more from the product that it actually delivers. However, the product is not too far from a very good product.
Here are the things we would want to see improvements upon:
1. The product should ideally support all the visualizations present in Qlikview (sister product of Qlik Sense)
2. A more intuitive and connected data discovery - editing and exploring on the same tab.
3. The product should have the ability to print and export data stories to real PowerPoint files. In the industry, business users will be asking for it.
4. Loaded data and data models can be viewed in the data model viewer by source table view or internal table view. That type of functionality becomes a need to have when we start joining multiple sources together in dashboards view - a common requirement. We did not see how or where to define join types.
5. Today we can only share Qlik Sense apps with other Qlik Sense users. The sharing process is not elegant and entails copying all the source files to another computer. There is NO security in this free version. All the load scripts and source data files are available to the recipient. Needless to say, there is room for improvement in the free Qlik app sharing process.
Do we still use the tool in its current form?
Definitely, we are highly impressed by data story telling capabilities and ability to share visualizations freely. Overall, we think QlikTech is on the right track to raise the bar against other vendors. However, it needs to make a few changes before it is out with a killer product in the market.
That wraps up our detailed, high level evaluation of Qlik Sense Desktop. We believe there is much more to it than we have shared on this website. If you would like a deeper dive into Qlik Sense desktop, we recommend reviewing the Getting Started Content, watching tutorial videos, skimming through the documentation, reading the FAQs and of course giving it a try with your own data.
It is important to understand that every self-service tool is bound to produce fantastic results, provided you are the captain and the tools is your ship. By this we mean it's important to understand the tool and its features; but your ability to leverage the tool to get the best possible outcome is equally important for driving your business decisions in the right path.
Contribution of Qlik Sense to the DW/BI Industry
Main aim of data visualization and analysis is - how best we can visualize and analyze key findings and present them to the decision makers. Data visualization and analysis can greatly contributes to improvements in corporate business intelligence and organization productivity. Non-technical and business users rely on visual representations such as charts, maps, graphs etc to analyze, understand information more easily and quickly. When data volumes are very large, patterns can be spotted quickly and easily using visualization. As more and more data is collected, analyzing and understanding data becomes complex. So industry uses visualization and analyzing tools such as Qlik Sense. Moreover, we humans grasp the essence of data and analyse more quickly when they are represented in some pictorial form rather than huge spreadsheets.
Use of Qlik Sense tool help us optimize the data processing and analysis of the captured information. Having large amount of data leads to mismanagement in the data processing which in turn leads to more complex analysis results. Qlik Sense allows the industry to understand the data in a clearer and more targeted view based on business needs. Qlik Sense enables analysts with minimal development expertise to build and publish powerful analytical applications.
